Call statistics for the 2013 "Mental Disorders" call
Success rates of submitted proposals
The application procedure consisted of two stages: stage I “pre-proposal selection” and stage II “full proposal selection”, for details see Implementation of the call. Overall, 13 % of all pre-proposals were eventually funded.
Success rates are summarized in the table below.
| Stage I: Pre-proposal | Stage II: Full proposals | Funded projects | |
|---|---|---|---|
| No. of proposals | 91 | 39 | 12 |
| - Principal investigators involved | 369 | 149 | 46 |
| - overall funding requested | 83 M € | 36 M € | 10 M € |
| Proposal success rate | 43% | 31% |
Country of origin and gender distribution of the applicants
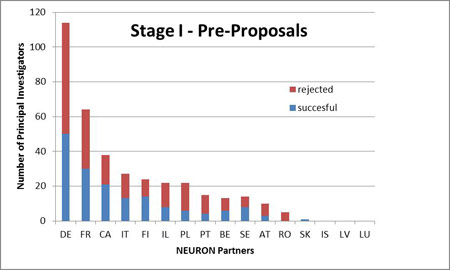
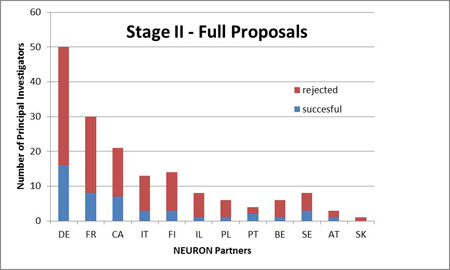
The number of successful principal investigators per country is displayed in Figure 1a (pre-propropols; stage I) and in Figure 1b (full proposals; stage II).
Coordinators of pre-proposals and funded proposals:
| Pre-proposals submitted (91 in total): | Funded proposals (12 in total): |
|---|---|
| Canada: 6 | Canada: 1 |
| Finland: 7 | Finland: 2 |
| France: 13 | France: 2 |
| Germany: 50 | Germany: 7 |
| Israel: 4 | |
| Italy: 3 | |
| Poland: 3 | |
| Portugal: 2 | |
| Romania: 2 | |
| Sweden: 1 |
Gender distribution
Pre-proposals: 29% of the principal investigators and 26% of the coordinators were female.
Full proposals: 34% of the principal investigators and 28% of the coordinators were female.
Funded projects: 38% of the principal investigators and 58% of the coordinators were female.