Call statistics for the 2019 "Biomarkers" call
Success rates of submitted proposals
The application procedure consisted of two stages: stage I “pre-proposal selection” and stage II “full proposal selection”, for details see Implementation of the call. The success rate was 42% of full proposals (21% of all pre-proposals).
Success rates are summarized in the table below.
| Description | Stage I: Pre-proposal | Stage II: Full proposals | Funded projects |
|---|---|---|---|
| No. of proposals | 71 | 36 | 15 |
| - Principal investigators involved | 282 | 154 | 60 |
| - overall funding requested | 57.3 m€ | 31.3 m€ | 12.1 m€ |
| Proposal success rate | 51% | 42% |
Country of origin and gender distribution of the applicants
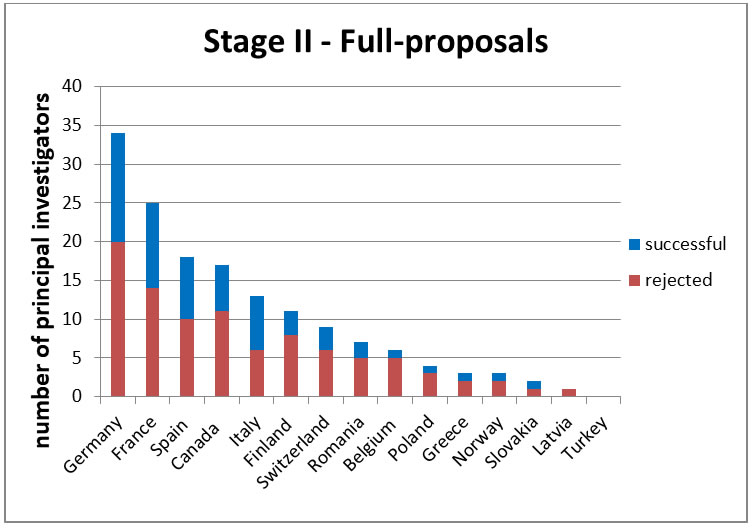
The number of successful principal investigators per country is displayed in Figure 1a (pre-proposals; stage I) and in Figure 1b (full proposals; stage II).

Coordinators of pre-proposals and funded proposals:
Pre-proposals COO (71 in total)
| Country | Number |
|---|---|
| Turkey | 4 |
| Germany | 18 |
| France | 11 |
| Canada | 3 |
| Finland | 3 |
| Spain | 10 |
| Italy | 9 |
| Romania | 2 |
| Switzerland | 3 |
| Belgium | 3 |
| Greece | 4 |
| Norway | 1 |
Funded projects COO (15 in total)
| Country | Number |
|---|---|
| Germany | 3 |
| Romania | 1 |
| France | 3 |
| Italy | 3 |
| Spain | 2 |
| Belgium | 1 |
| Canada | 1 |
| Greece | 1 |
Gender distribution
The percentage of female researchers participating in this call is shown in Fig.2.
